

Why does you data need to be “Normal”?
Jan 14, 2022In our formative teenage years, we were told that we should be unique, stand out, be ourselves and not chase complacency with being normal. We’ll you’re data isn’t you and a lot of times for it to be compatible with stats it needs to follow a, “normal distribution”. Instead of just telling you to follow my orders because I have a fancy blog, let’s figure out why being normal is important. Let’s take this example where I have a truck and a bunch of heavy metal water spilled from it. We want to start jumping right into this dataset, but there are a few things we need to do as environmental scientists.
 Figure - My artistic impression of a truck spilling contaminated water
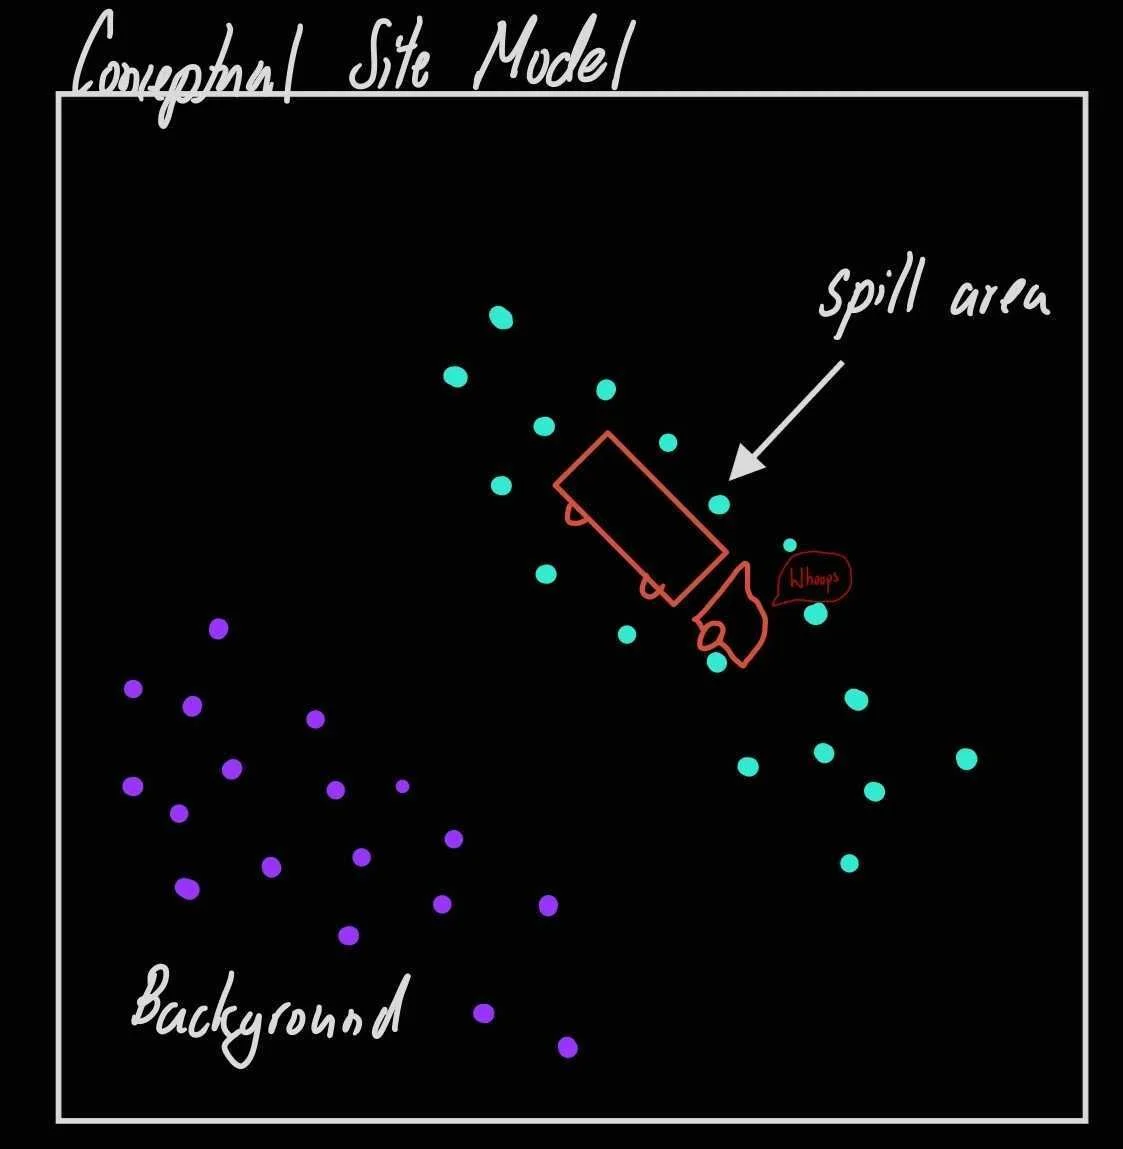 Figure - My artistic impression of a truck spilling contaminated water
Prior to making any statistical inference, the distribution of the metal and TSS data is required to be assessed if outlier concentrations are present due to variability in the measurement or experimental error. This preprocessing procedure is referred to as:
Data Normalization
The goal of normalization is to change the values of numeric columns in the dataset to a common scale, without distorting differences in the ranges of values. The normalization approach to a data set is required to accurately report trends in the data when the overall distribution is not Gaussian (a bell curve). In order to confirm whether data needs normalization for the distribution of metal concentrations, the Shapiro-Wilk test for normality was performed on the data set.
Shapiro-Wilk test
The Shapiro-Wilk test is a routine statistical assessment that quantifies the similarity between the observed and normal distributions as a single number which:
superimposes a normal curve over the observed distribution (Figure Below).
It then computes which percentage of our sample overlaps with it:
a similarity percentage.
Finally, the Shapiro-Wilk test computes the probability of finding this observed -or a smaller- similarity percentage. It does so under the assumption that the metal concentration distribution is exactly normal:
thenull hypothesis.
The null hypothesis for the Shapiro-Wilk test is that a variable is normally distributed in some population. The null hypothesis is rejected if p < 0.05. If the null hypothesis is rejected, we conclude that our metal concentration is NOT normally distributed.
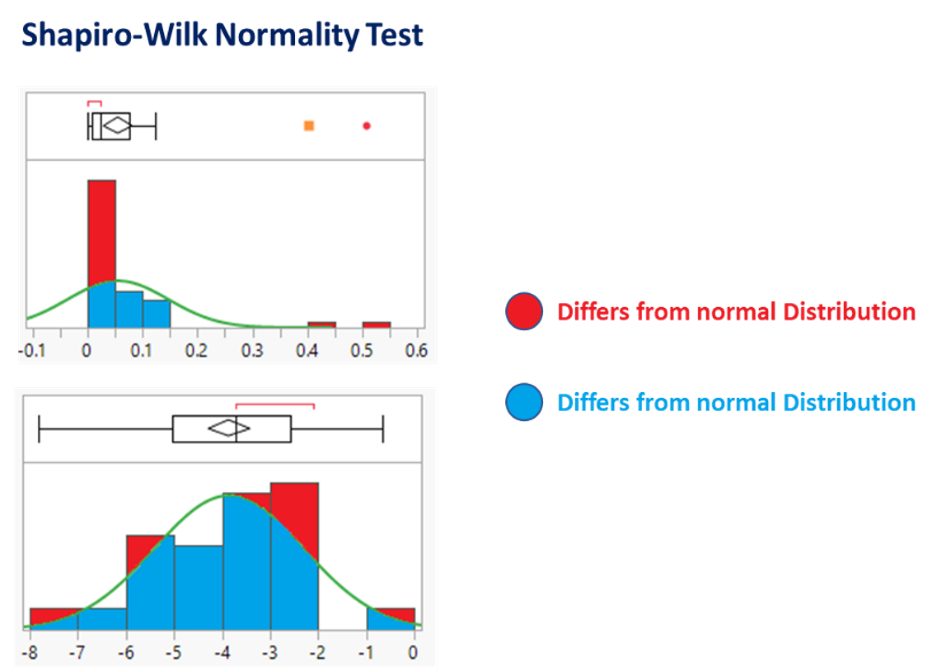
Figure - Red = bad. Shapiro-Wilk Normality Test visualization of similarity percentage for the distribution of Arsenic (As) before (top) and after (top) log normalization. The illustration demonstrates that the log normalization of metal data increases the similarity percentage, while producing a Gaussian distribution.
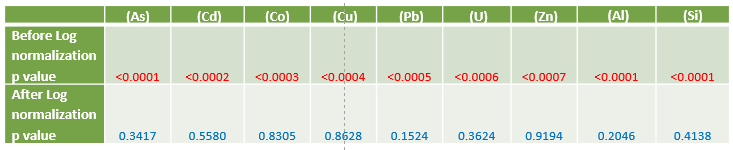
Table – Shapiro-Wilk test results for metals before and after log normalization. Larger numbers are good
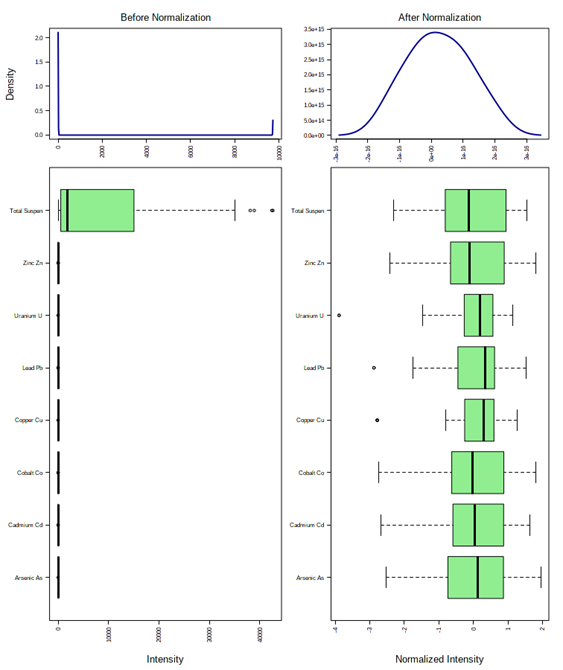
Since the p values are less than 0.05, the Shapiro-Wilk Test confirms that all the metal concentrations are not normally distributed (Table above). As illustrated in the distribution in the spilled metals (the site) (Figure Below; left), the distribution is highly skewed. When further analysis such as multivariate linear regression is conducted, the attributed concentration of metlas will intrinsically influence the results more due to its larger distribution. If data does not exhibit normal distribution, parametric statistics or regression analysis cannot be used to examine the relationship between metals and TSS.
As the study parameters are to assess the relationship between metals , the data needs to be normalized so that the null hypothesis can be accepted. This is accomplished by Logarithmic (Log) transformation of the data, which results in a common scale without distorting differences in the ranges of values. After this transformation, the data exhibits an increased similarity percentage (Figure above), Shapiro-Wilk Test results confirming the null hypothesis that the data is distributed normally (Table above) and distributions become scaled evenly (Figure below).
I am always happy to chat about how to properly kick off your environmental consulting project and get things on the right track for stats. Always feel free to shoot me a message on here through my contact page!
MAKE YOUR DATA TALK.
Let's explore the ways I can support you.
Stay connected with news and updates!
Join our mailing list to receive the latest news and updates from our team.
Don't worry, your information will not be shared.
We hate SPAM. We will never sell your information, for any reason.
