

The Subjective Question of, “What is an Outlier?”
Mar 24, 2022What is an outlier? In chemical analysis, this is the fundamental question to distinguish between a real value and one that may be artificially created by human error. However, this question is very subjective and depends on who you are asking. For instance, a government regulatory may say something along the lines of, “The documentation (likely created in the early 1900s) says anything above this number is an outlier, so we blindly trust this”. While a statistician may argue that this is an outdated process. However, who’s right or are they both right? A quick google search I found this quote that describes outliers that I liked the best:
”Observation which deviates so much from other observations as to arouse suspicion it was generated by a different mechanism” - Stephen Hawkins (1980)Here is Mike’s definition on outliers: Extreme values that deviate from other observations on data, which may indicate a variability in measurement, experiment errors or a novelty.
I’m big on examples and tailoring things to my niche field (chemical forensics + analytical chemistry). Let’s take the example that we’re a forensic investigator looking at a petroleum spill on the shore of some hollywood star’s private island. The famous hollywood client heard that polyaromatic hydrocarbons (PAHs) are bad for their chakras so they want you to measure all the sediment samples nearby to the spill. I use these wacky sort of examples because they set the stage well and are a fun change to the stale examples given in textbooks. Either way, we decide to analyze two PAH compounds to determine if they are coming from the same source. We know that these compounds are correlated and that a linear association should be expected if all PAHs are sourced from the same material.

Figure 1 showcases a biplot with two polyaromatic hydrocarbon concentrations with total concentration being representative of the size of the data point. It is evident from this data visualization that there is a positive correlation between the two PAHs. However we can see two high concentration samples sticking out like sore thumbs: 1) the higest concentration sample (biggest dot) almost all naphthalene (NAP) with little to dibenzothiopene (DBT) and 2) with the exact oppostive profileSo what is causing these two samples to plot away from the majorty of samples and how do we systematically assess this? Generally in forensic toxicology/environmetal science it is established that samples with high concentrations are generally, “source”, samples originating from a unique as you guessed it source. So we need to be cognicent of this while assessing these samples for outliers. We can see that the majority of samples showcase a strong correlation between each other indicative of a similar source (more than happy to write about univariate correlations as a blog if someone would like!).
Sources of Outliers
- Human typo creating sample orders of magnitude above. This stems from either an incorrect unit conversion or the removal of a decimal point. Another point to automate code!
- A real unique source sample. Let’s jump back into our hollywood star context. Perhaps we dive into the data and find out that one of the outlier samples was collected nearby to their billion dollar yacht, which uses a different fuel than the one spilled. So in theory these may be real sources, but very localized to that sample only.
- Differences between laboratories. Some labs are more reputable and hence more sensitive instrumentation. Also different quantification methods.
Why is this important? Why not always use the best method for analysis?
- Temporal comparisons. It Is important to understand how concentrations change with time especially for long term studies as those with remediation. If two different laboratory methods are used to quantify the PAHs on the celebrities private island how can we make sure that the PAHs won’t effect their chakras long term?
- Budgets. This is usually the fundamental one that effects the analysis. I use this simpsons analogy for industry & academia all the time (see relatable meme below). In academia, you can play around with sensitivities till the cows come home since you have all the time in the world since your labor is free. You leave grad school and the next student takes on your project (hopefully you leave them a detailed notebook), however how are the results going to be replicated and will these be similar? In industry however, method optimization sometimes (emphasis on sometimes) takes a seat on the bench when a client demands an inhuman turn around. So it’s a battle between these two that the analytical chemist faces

Let’s jump to the objectives since everyone wants answers (and codes generally). Here I’m going to provide the outline of different techniques, but each one of these can be a blog in itself and contain some applicable code in R or Python or SAS. I am always receptive to know what the reader wants so if someone wants specific codes or a long example of a technique let me know so I can tailor my approach with that.
Objective ways to use statistics to determine outliers
Quantile Range Outliers
These are your traditional first introduction that are presented in Stats101. The quantile distribution of the values is arranged in a column and extreme values are calculated based of this. These are useful for detecting outliers becasue there is no distributional assumption associated with them. This keeps things relatively simple, but as we’re aware forensics is never as cut and dry as that. Often times with analytical chemistry your data is left censored since we have an abundance of very low values detected. This trend is continuing with the rapid advancement of analytical chemistry to detect lower numbers and have a larger dynamic range for what can be quantified. In this outlier approach data is simple sorted from smallest to largest. Regulators and the Government (you know innovative folk) adore using these to make the science black and white
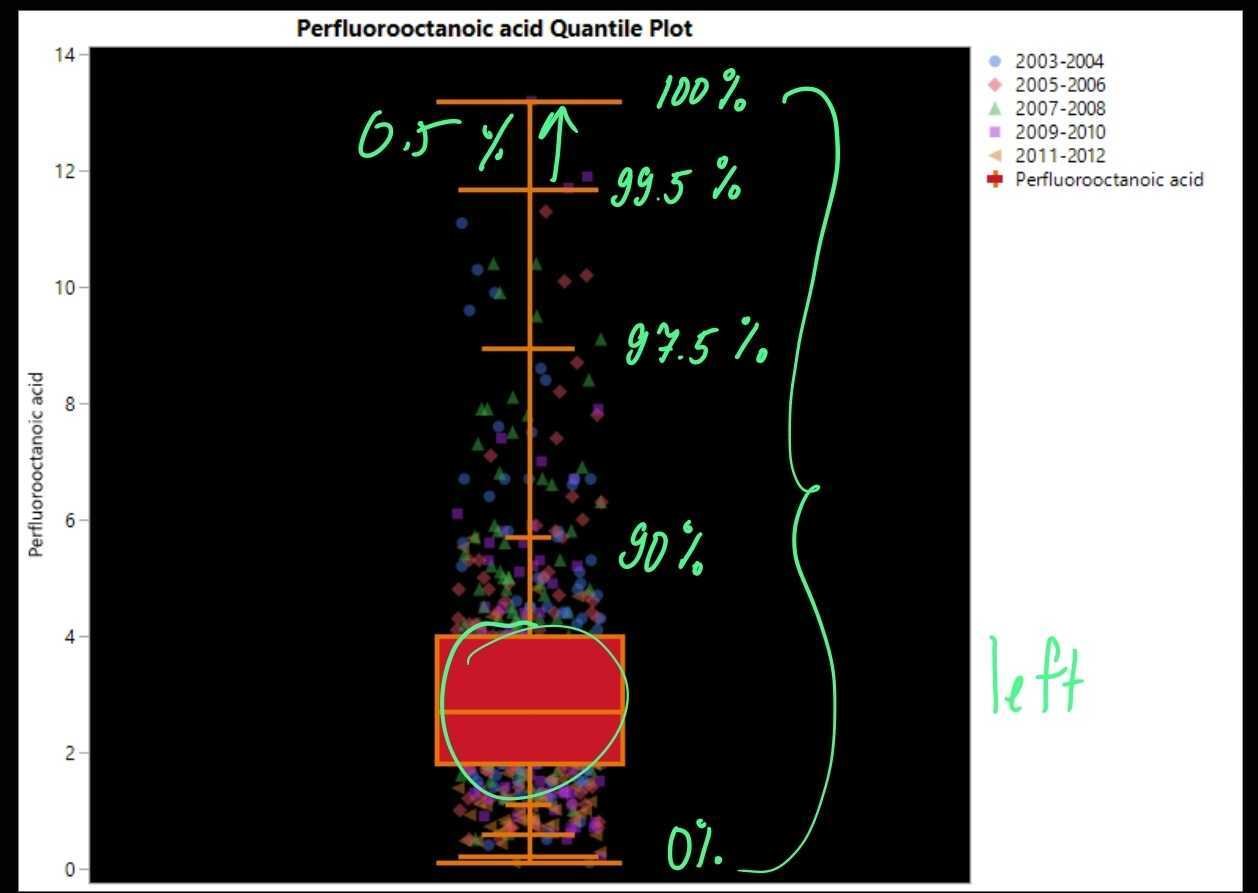
On the left we have an example of a biomonitoring quantile example. We can see that the analytical measurements are left sensored with the majority of the values being on the lower end. The assessment of exposure to an environmental chemical can be done by comparing an individual to reference values from the general population. These reference values provide an upper margin for the current background exposure of the general population. Reference values are used to identify subjects with an increased level of exposure (relative to background population). Often the 95th Percentile is used as that reference since no one should be above the 95th percentile of the control group. In a way anything above these values in the control can be considered an outlier. These will often be removed prior to calculating the reference statistics such as means since they can ariticially increase the number.
MultivarIate Outliers
What do we do with datasets containing a large amount of chemical species? Are we going to look through all the distributions and determine if a compound exceeds our quantile threshold?Diving bak to our holiday star example. What if he know wants to measure PFAS since that’s the hot new contaminant that all the celebs are talking about? What if we are dealing with bioinformatics now or a field that contains a vast array of measurements. We can’t be expected to assess quantiles for all of them. We could loop a 95th percentile calculation throughout our data, but luckily P.C. Mahalanobis has come up with some important math for us!
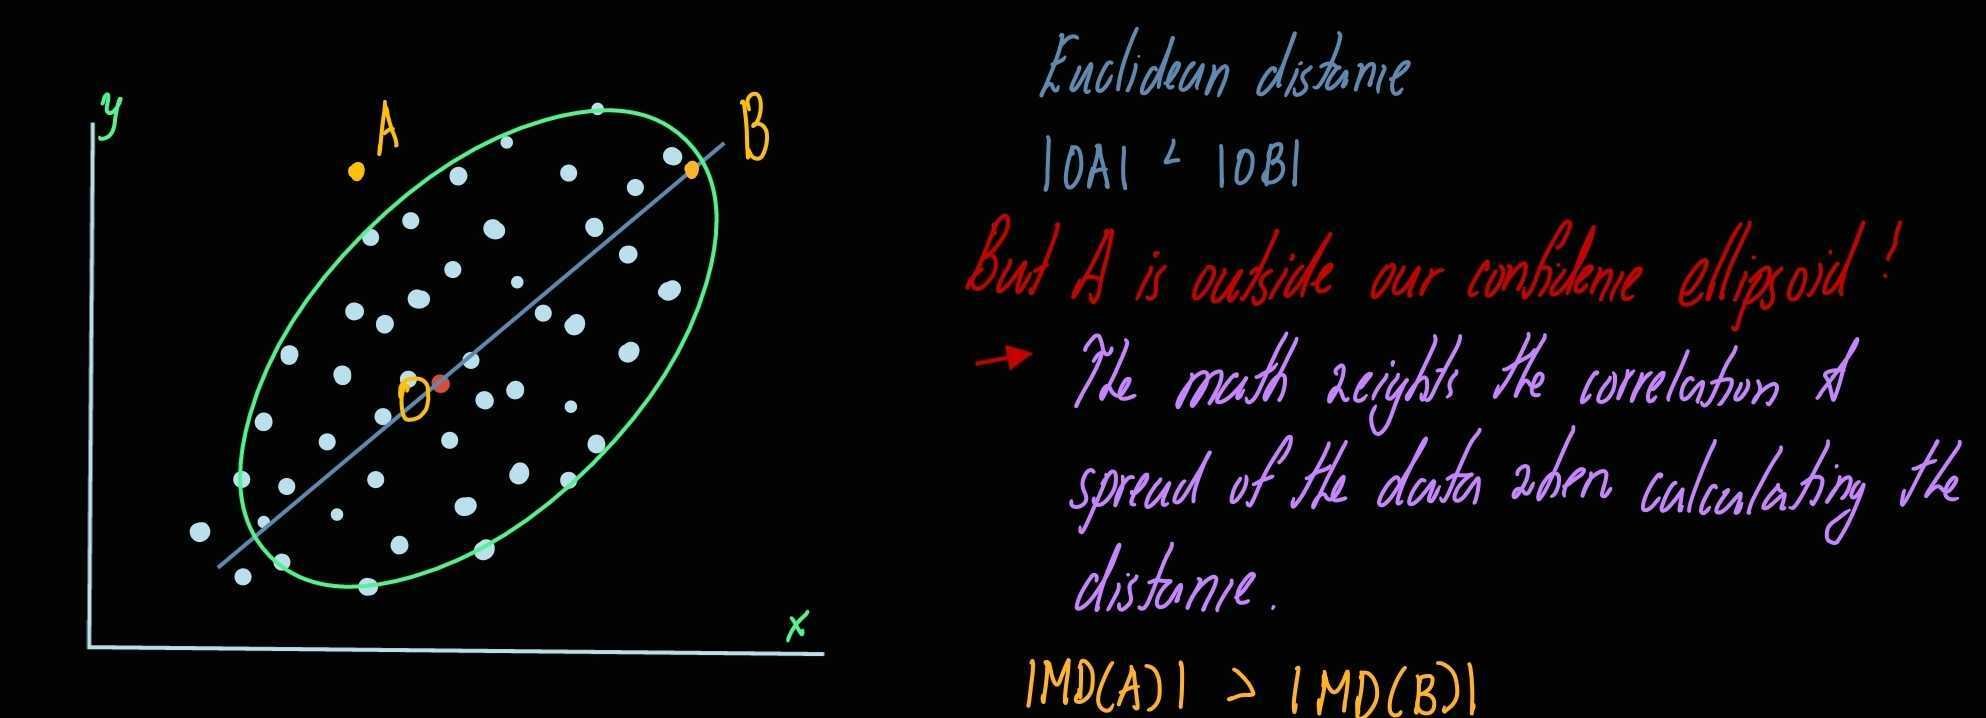
Mahalanobis Test
Calculating the Mahalanobis distances from multivariate mean (centroid). What we are essentially doing here is doing a dimensional reduction technique akin to what is done with PCA/t-SNE/UMAP. From this we can establish a profile that does not match the others based on the differences in Mahalanobis distance. These diistances depend on estimates of the mean, standard deviation and correlation of the data. This is computted in n dimensional space (hence the name multivariate).
This blog may open up more questions as there are a lot of different ways to compute the math of calculating outliers. In future blogs, I’ll narrow down the approach by providing specific codes to get theses tasks complete and provide real life examples! I’m always looking for feedback or an opportunity to showcase my workflows. If you have data that needs interpretation always feel free to contact.
MAKE YOUR DATA TALK.
Let's explore the ways I can support you.
Stay connected with news and updates!
Join our mailing list to receive the latest news and updates from our team.
Don't worry, your information will not be shared.
We hate SPAM. We will never sell your information, for any reason.
